Xdebug is a PHP extension that, as the name suggests, enables debugging and profiling of PHP scripts. This extension boosts developer’s productivity by speeding up the debugging information loop. With Xdebig, the developer spends less time finding out the reasons behind errors and understanding the logic of operation of an unknown block of code.
This article covers setting up debugging with the help of PhpStorm relying on Xdebug, when the project resides on a remote server. Below you will find the five steps you need to make to start debugging. We will not dive into the extensive features of PhpStorm in this article.
Step one
Install and enable Xdebug for PHP as per the documentation.
parameter descriptions to get a better understanding of what is what.
xdebug.remote_enable=1
xdebug.remote_host=localhost
xdebug.remote_port=9000
xdebug.profiler_enable=0
xdebug.profiler_output_dir=/tmp
xdebug.profiler_output_name="debug-cachegrind.out"
xdebug.profiler_append=1
xdebug.profiler_enable_trigger=1
Step two
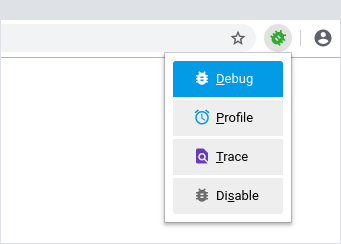
Install browser extension. It is not a mandatory step, but you may want to do that to simplify debugger activation. If you do not use the extension, you will need to set the GET/POST or COOKIE parameter manually.
Step three
Open terminal on your computer and type in the following to create an SSH tunnel.
ssh -R 9000:localhost:9000 <username>@<host> -p <port><replace username etc with your actual values>
Step four
Create a project in PhpStorm, if you have not done that already. There is no need to download the entire code of the project to your computer, you can get only the files you need to debug. But, truth be told, it is often more convenient to work with the entire code within reach.
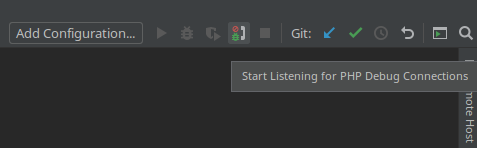
Hit Start Listening for PHP Debug Connections on the panel to have PhpStorm process incoming Xdebug connections. You can also switch listening on in the main menu, Run | Start Listening for PHP Debug Connections. Click it again to make things as they were.
Step five
Set the halt point, activate the debugger (using the extension or manually) and open the debugging page in your browser. If PhpStorm automatically matched locally stored files and those on the server, it will open the debugging window right away. Else, the debugger will suggest collating files manually, presenting a list of possible options.
This is it. You are done setting up PhpStorm relying on Xdebug. Some comments to wrap it up…
- PhpStorm documentation contains a large section, dedicated to setting up the debugging features. Do refer to this section if something goes wrong or is unclear.
- Besides Xdebug, PhpStorm supports Zend Debugger.
- You can use a command line client to check if your SSH tunnel is working and Xdebug is sending the debugging info. This approach allows diagnosing the problems, if any, discarding the IDE factor from the outset.
- The following error: "Cannot accept external Xdebug connection: Cannot evaluate expression 'isset($_SERVER['PHP_IDE_CONFIG'])'", may be caused by a variety of reasons. In my case, for example, I had both Xdebug and Zend Debugger running simultaneously. Shutting down Zend Debugger did the trick.
Add new comment