Site page load speed and its effect on bounces and conversions
There are many tricks owners and admins of online stores, portals, landing pages resort to in order to attract visitors to their sites. They order original and beautiful designer templates, try to fill the site with interesting and meaningful content, come up with various ways of interacting with visitors, run costly ad campaigns. They do all this to achieve one goal, which is to attract as many visitors as possible in hopes to increase the number of deals, purchases and other profitable transactions.
Articles that cover commercial efficiency of websites and ways to improve it mention design, content quality, usability, updates and code quality as the main factors contributing thereto. No argument, all of them are important.
However, it often happens that a true masterpiece, a site that consumed absolutely unthinkable amounts of money, effort and nerve cells, designed by the best designers and filled with carefully thought-out and search-optimized content, this site, for some reason, does not grow wildly popular, as was expected, and does not deliver as intended.
The most common problem behind such a situation is lack of attention to page load speed. In other words, the effort goes into making it beautiful, and no one really cares how fast this beautiful is. However, as the dedicated studies indicate, page load time requires special attention.
For example, Akamai, a website acceleration service provider, conducted research and found the following:
- 47% of users expect a web page to load within 2 seconds;
- 40% of visitors can bounce if a page loads for more than 3 seconds;
- 52% say page load speed affects visitor loyalty;
- 3 seconds of waiting reduce customer loyalty by about 16%.
Google seconds that: «If a site takes longer than 3 seconds to load, 53% of users leave it.».
A study by Pat Meenan of Google and Tammy Everts of SOASTA also produced some very interesting results, which were presented at the Velocity 2016 conference.
«...This study used a special counter (mPulse systems) to collect data from multiple live e-commerce sites. The data collected described operating system, browser, geography, session duration, request headers, page load times, connection speed, page composition (number of elements, pictures, etc.). Over 1,100,000 page loads were analyzed...»
The study identified six main factors affecting conversions and bounce rates:
- Number of elements on a page;
- Number of images on a page;
- Number of scripts (JavaScript);
- Page load time (when the doc was received);
- Full load time;
- HTML document generation time.
The first three points are about page contents, the next three - about page load speed. The conclusion is obvious: the speed at which site pages are loaded affects bounce and conversion rates.
Based on the results of the cited studies, all website owners wishing to improve conversion and/or visitor engagement figures are advised to check how quickly their sites load and invest in their acceleration.
From the visitor's perspective, the situation is quite simple: no one likes to wait for a page to load, and everyone loves when the content requested fills the browser almost instantly. The faster the site pages load, the more enjoyable the visit is for the user and the more this user respects the site owner.
The opposite is also true: the slower the site, the less the visitor thinks of its owner, which drives conversion chances down.
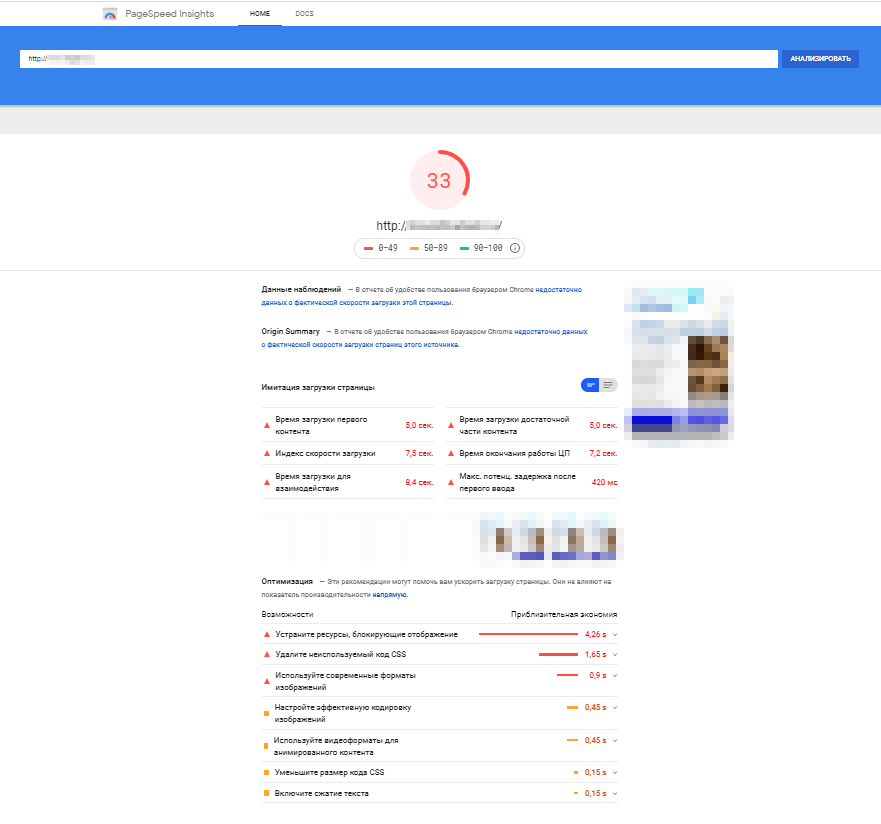
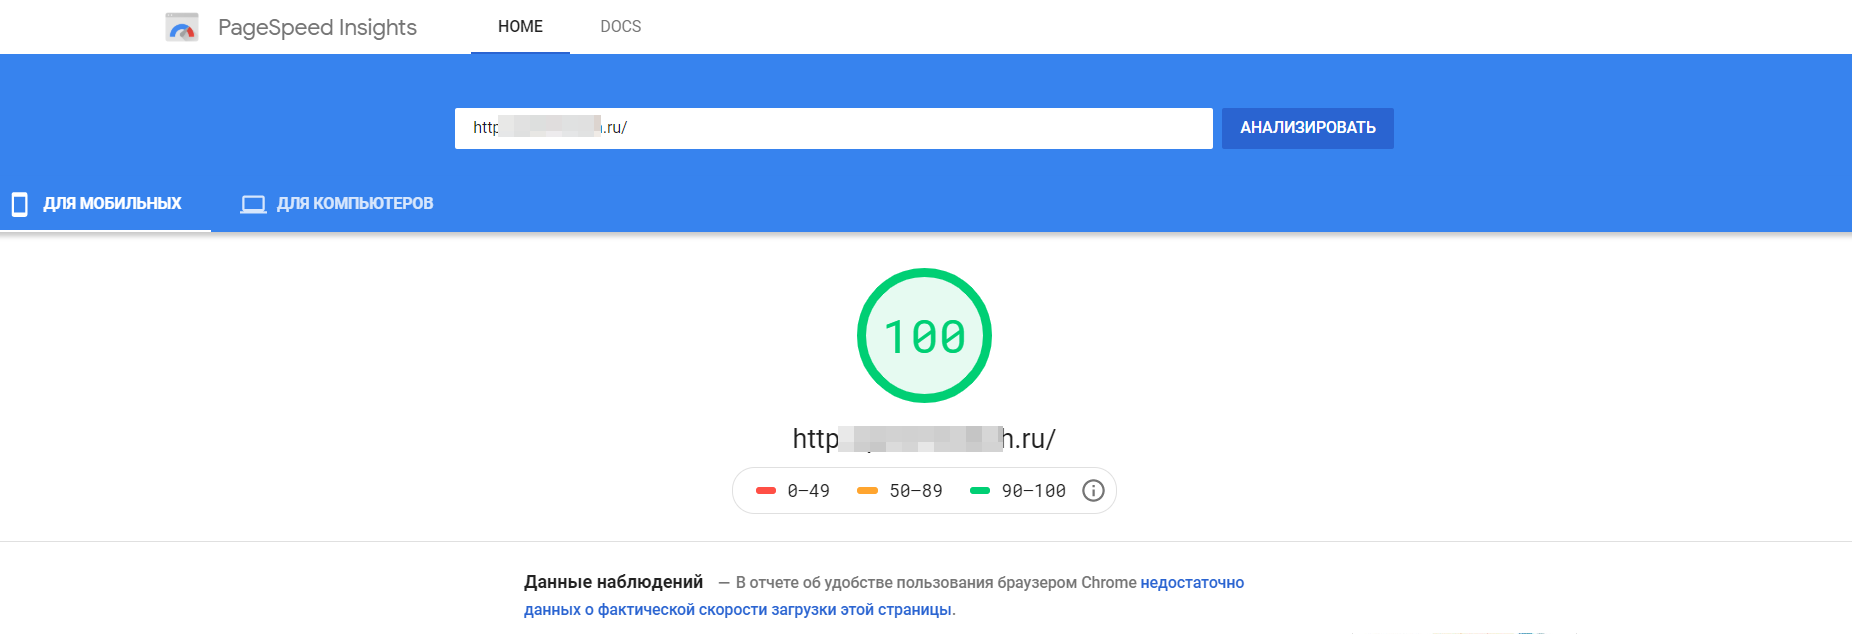
Simply opening your site in a browser on your computer is not enough. This exercise does not show you the real state of affairs. There are third-party services specifically designed to test site load speed that reveal the true picture. PageSpeed Insights — Google Developers, for example, completes the page load speed data (desktop and mobile versions) with a list of suspected problems.
If website pages load slowly because of the content, it is relatively easy to find and remedy the problems: you just optimize the amount and volume of visual content (pictures), shrink and optimize stylesheets, javascripts, HTML code. As a rule, websites built by professionals are not plagued with errors in their code or visual content, but may still have some. On the other hand, these occasional defects are easily identified and remedied during site "break-in", i.e. pre-launch testing.
Some other possible reasons for poor site performance include low speed of network interfaces (hardware level) and low physical bandwidth of the telecom infrastructure web server relies on to get online. Choose hardware and connections wisely, seeking to meet the speed and bandwidth requirements you have.
If your site is a catalog or an online store enjoying thousands of visits a day, serving content from a large database and processing a large number of transactions, page speed may deteriorate because the web server itself is under a high load and simply fails to process all the queries in a timely manner. As a rule, this kind of failure happens when there are hard drives involved that supply the data on request, such hard drives not fit for purpose because their interfaces are too slow.
Task setting
This article describes a real case of web server optimization. We helped a client make and launch an online store, and it turned out to be a very good idea. The store is a commercial success, and the number of customers grows day by day. Over time, the server exhausted its resources and could no longer serve duly under the increased load. The site grew slow, which was especially noticeable during peak hours.
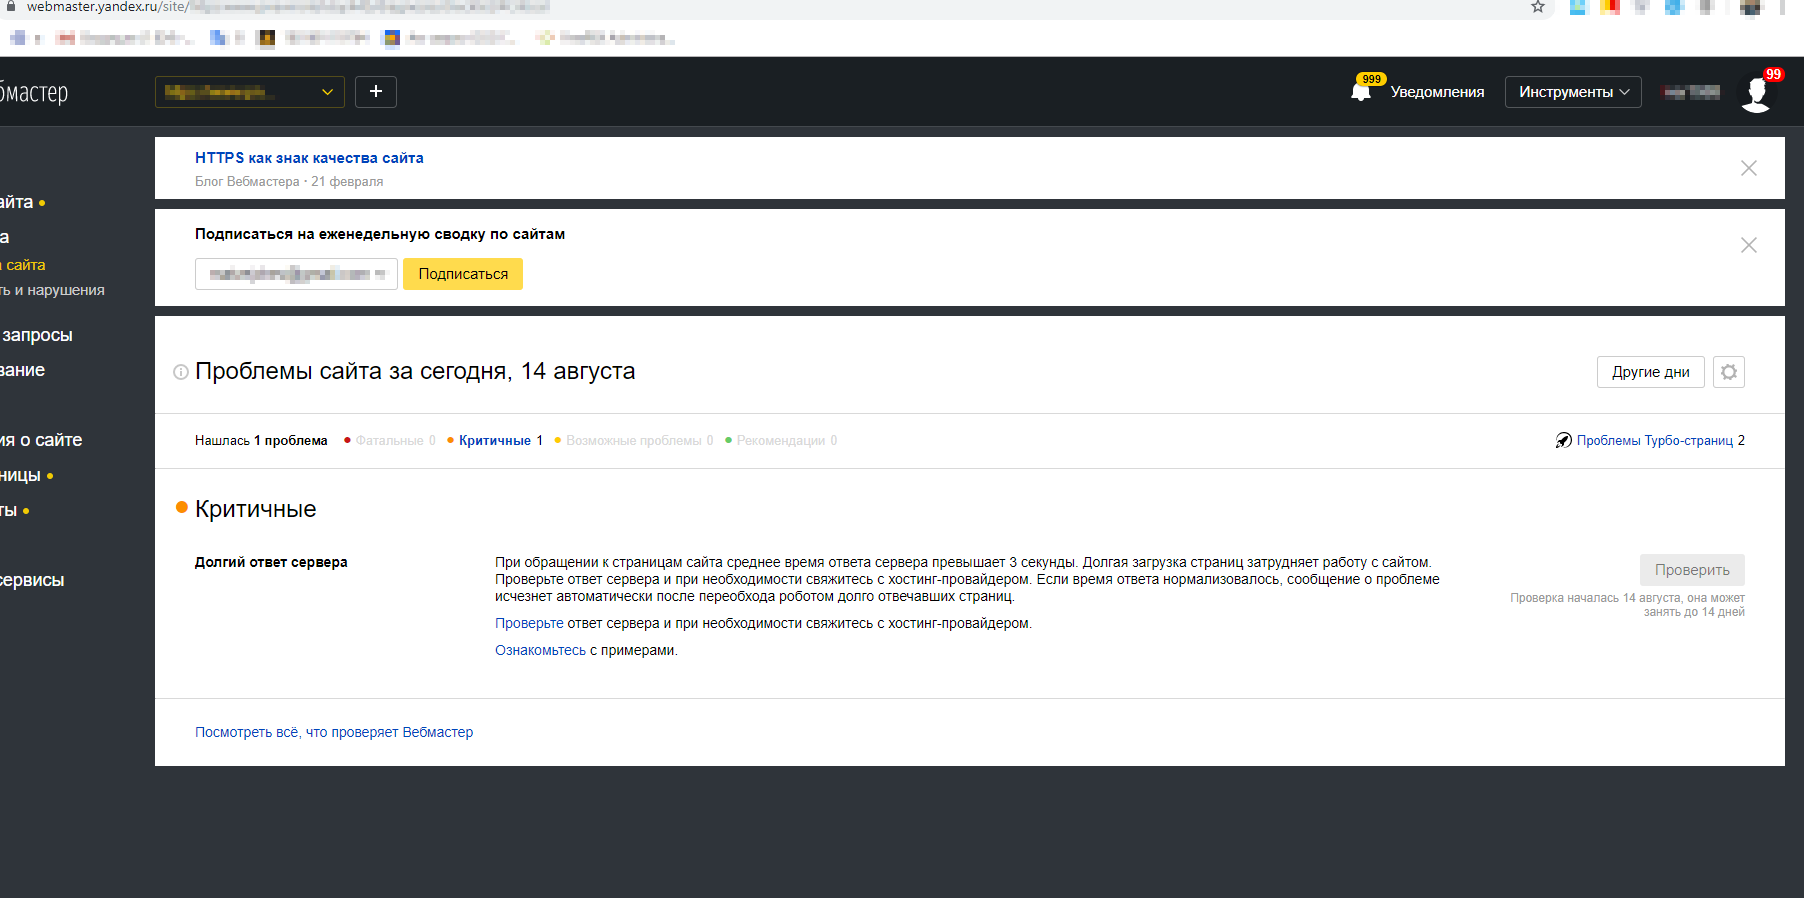
We ran tests and learned that the average page load time was over 350 ms, and sometimes site visitors had to wait more than one second for a full page load even when the traffic was low overall. The problem could no longer be ignored, since the store continued to attract more and more visitors, which moved the load time of "slow" pages beyond the critical 3 seconds and triggered warnings in the webmaster service dashboard.
Therefore, it was decided to optimize the server so as to reduce the processing time of incoming requests and speed up data delivery.
Caching, which implies putting the most commonly requested pages into RAM for quick access, is the basic cure for slow sites and low information exchange speed. Drupal-powered websites typically rely on Memcached to enable caching. Memcached is a utility that orchestrates caching based on a hash table. Web server optimization and site performance boost through caching are the key topics covered in this article.
Optimization of online store forms and caching of pages with forms
The time it takes the web server to generate a page is one of the key site performance metrics. On our side, we employ system administrators, DevOps specialists and coders to do website optimization work and reduce page generation time. They cooperate closely with specialists from the hosting provider and from the customer's. For the purposes of slow page profiling, specific PHP functions execution time analysis and bottleneck identification we use XDebug.
New Relic enabled page request processing time stats monitoring/aggregation and collection of the MySQL and Solr query execution speed figures.
This article describes a problem rather common for Drupal-powered sites and shows a solution that allows reducing the time it takes a web server to process a request for an online store page by 32%.
Problem
Drupal 7 has a longstanding "feature": with AJAX framework backing the process, a form on a page is cached automatically. Each output of such a form creates two entries in the cache_form table, one describing its structure and the other its state. Correct operation of the AJAX handler requires caching, since it needs to know the form's structure and its last state.
In case there are many forms on a page, the number of entries to the cache_form table can grow rapidly, which is a problem. For example, Add to Cart function in the Commerce online store module: a request to display 50 products will create 100 entries in the cache_form table each time a visitor views the relevant catalog page. For high traffic Drupal-powered online stores, this can mean tens of gigabytes of data in the cache_form table.
In Drupal 7, you can set the minimum cache lifetime (see Performance tab), which, as the name implies, determines page cache expiration. If form cache clears out before page cache, the page in question will return incorrect POST data error when you try to interact with the form thereon. If you do set the minimum cache lifetime for pages, form cache will persist through this time, too.
Several solutions to this problem have already been developed.
- form_cache_expiration variable, introduced in Drupal 7.61 and granting control form cache storage time (6 hours by default). The key disadvantage is that form_cache_expiration leans on the outdated cache cleanup heavily. If this routine does not kick in time, the size of cache_form continues to grow.
- OptimizeDB module.Allows flexible, cron-enabled configuration of cache_form table clearing. There is a choice between clearing the table out entirely or getting rid of outdated records only, but the latter option creates the risk of incorrect form POST data errors while the cache_form table still remains too large.
- The Safe cache_form Clear module instructs Drush to clear outdated entries in the cache_form table. The disadvantages of this module are similar to those of OptimizeDB.
- Commerce Fast Ajax Add to Cart module. A solution by xandeadx aimed at the root of the problem: caching the standard Drupal Commerce's add-to-cart form. The downside of the solution, oddly enough, is that it does not rely on the AJAX framework, while for the project we had at hand the developers have already written a non-standard add-to-cart dialog using Drupal AJAX commands. In addition, this solution is not universal, it only works for the add-to-cart form.
- Patch #94 from this issue. Applying the patch alone does not solve the problem, you also need to code a handler for the form in question. Moreover, this solution tends to go unstable on pages with multiple forms. And, of course, the need to patch the core is a huge drawback in itself.
Solution
For the purpose of this case, let's consider a clean Drupal 7.67 instance with Commerce 1.15 added thereto. We use Views to make catalog pages; each has 50 products, with every product teaser coming with the Add to Cart button. To make things simple, we let Commerce Devel to generate the products. AJAXing the Add to Cart button is the job done by the Commerce Ajax Add to Cart module.
Let's browse to the catalog page, then check the cache_form table. There are 100 new entries there now. We have successfully reproduced the problem.
This article suggests solution partially based on this comment. Deploying this solution requires coding a small custom module or adding some code to an existing one. We take the former path.
The first step is to define the path for the new AJAX form handler. It is very similar to the «system/ajax» path in the system module.
/**
 * Implements hook_menu().
 */
function custom_menu() {
  $items['custom/form/ajax'] = array(
    'title' => 'AJAX callback',
    'page callback' => 'custom_form_ajax_callback',
    'delivery callback' => 'ajax_deliver',
    'access arguments' => array('access content'),
    'theme callback' => 'ajax_base_page_theme',
    'type' => MENU_CALLBACK,
  );
  return $items;
}
Next, we change the Add to Cart button's AJAX handler path. Do not confuse path and callback properties here: the former specifies the address to which the AJAX query will be sent, the latter names the function invoked to generate the reply to this query. Typically, path remains unfilled, which means it defaults to «system/ajax». This is what we change. Also, we force caching of the form we are after off.
/**
 * Implements hook_form_alter().
 */
function custom_form_alter(&$form, &$form_state, $form_id) {
  if (strpos($form_id, 'commerce_cart_add_to_cart_form') !== FALSE) {
    // We specify that we want to independently handle the AJAX request to the form.
    $form['submit']['#ajax']['path'] = 'custom/form/ajax';

    // Disable form caching.
    $form_state['no_cache'] = TRUE;
  }
}
Finally, we implement the custom_form_ajax_callback() function that we have paved the path to as «custom/form/ajax». The code of this function is partially same as that of ajax_get_form() end ajax_form_callback(). The idea is to get the needed state of the form without using the cache, since we have already disabled it.
It is important to note that the code below is universal. It can be used to disable caching of other AJAX forms, with the exception of the block that builds the product displayed. This is the block generating the form in the state needed for it to successfully go through validation and be submitted. If you need product attribute support, you will have to customize the block of code. Other forms would require the same code to function similarly.
/**
 * Menu callback; handles Ajax requests for forms without caching.
 *
 * @return array|null
 *   Array of ajax commands or NULL on failure.
 */
function custom_form_ajax_callback() {
  // Check what we process, should be AJAX query to the form.
  if (isset($_POST['form_id']) && isset($_POST['form_build_id'])) {
    $form_build_id = $_POST['form_build_id'];
    $form_id = $_POST['form_id'];
    $commands = array();

    // Initialize state of the form.
    $form_state = form_state_defaults();
    $form_state['build_info']['args'] = array();

    // Fill out state of the form. This code is unique within the processed form.
    // Check that the form worked with is the add to cart form.
    if (strpos($form_id, 'commerce_cart_add_to_cart_form_') === 0) {
      $product = commerce_product_load($_POST['product_id']);

      if (!empty($product)) {
        // Generate product based on the form data submitted.
        $line_item = commerce_product_line_item_new($product, $_POST['quantity'] ?? 1);
        $line_item->data['context']['product_ids'] = array($product->product_id);
        $line_item->data['context']['add_to_cart_combine'] = TRUE;

        // Add the product to the form state.
        $form_state['build_info']['args'] = array($line_item);
      }
    }

    // Build the form; relevant builders and hooks are called.
    $form = drupal_retrieve_form($form_id, $form_state);
    drupal_prepare_form($form_id, $form, $form_state);
    $form['#build_id_old'] = $form_build_id;

    // Process the form same way as ajax_get_form().
    if ($form['#build_id_old'] != $form['#build_id']) {
      $commands[] = ajax_command_update_build_id($form);
    }
    $form_state['no_redirect'] = TRUE;
    $form_state['rebuild_info']['copy']['#build_id'] = TRUE;
    $form_state['rebuild_info']['copy']['#action'] = TRUE;
    $form_state['input'] = $_POST;

    // Process the form same way as ajax_form_callback().
    drupal_process_form($form['#form_id'], $form, $form_state);
    if (!empty($form_state['triggering_element'])) {
      $callback = $form_state['triggering_element']['#ajax']['callback'];
    }
    if (!empty($callback) && is_callable($callback)) {
      $result = $callback($form, $form_state);
      if (!(is_array($result) && isset($result['#type']) && $result['#type'] == 'ajax')) {
        $result = array(
          '#type' => 'ajax',
          '#commands' => ajax_prepare_response($result),
        );
      }
      $result['#commands'] = array_merge($commands, $result['#commands']);
      return $result;
    }
  }
  return NULL;
}
Results
For the case considered, adding the above code keeps the Add to Cart button AJAX-powered even the form caching is off. Catalog page refresh does not translate into extra 100 entries in the cache_form table. AJAX request processing result is same as when form caching is on. If the form was changed via Drupal API (product attributes etc), the code may require minor modifications to its state-building part.
This solution is live on one of the websites we support. The results it delivered are as follows.
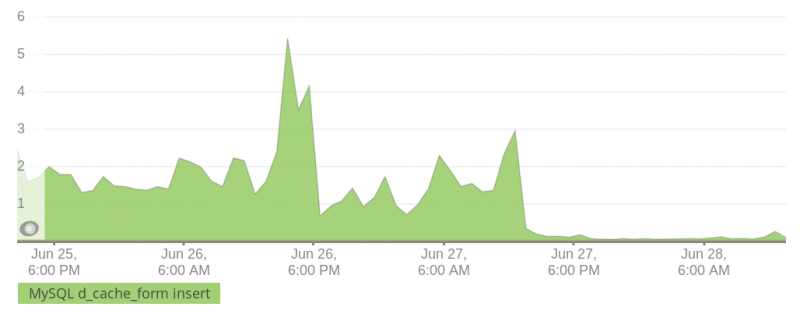
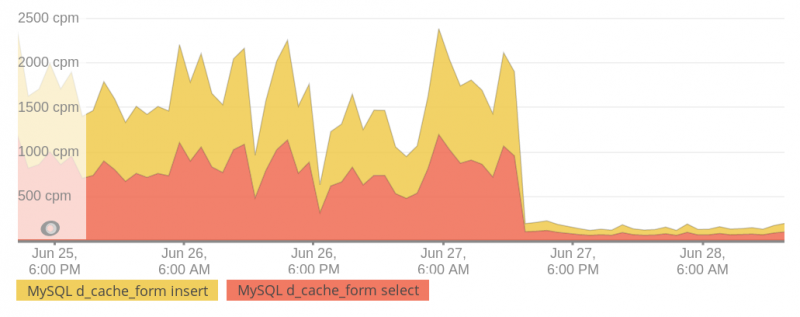
- Ten times less SELECT queries to the cache_form table;
- Ten times less INSERT queries to the cache_form table;
- Thirty-two percent faster query processing on the server (dropped from 352 to 241 milliseconds).
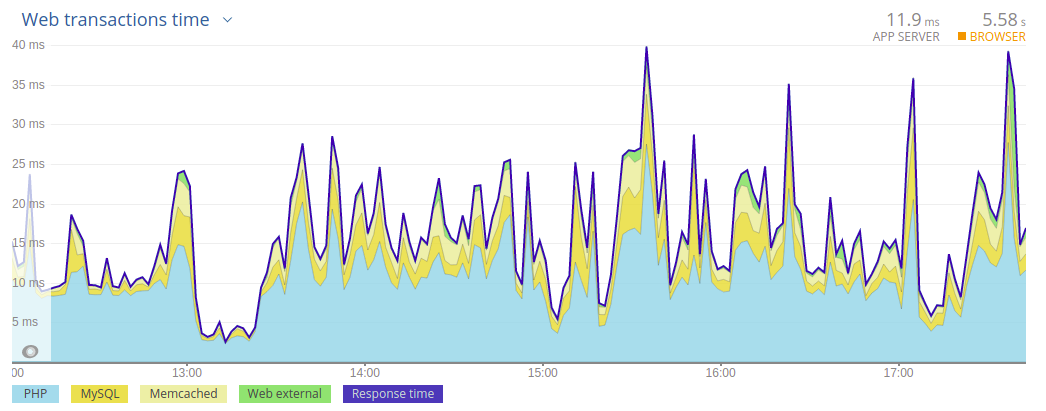
See the screenshots for detailed stats.
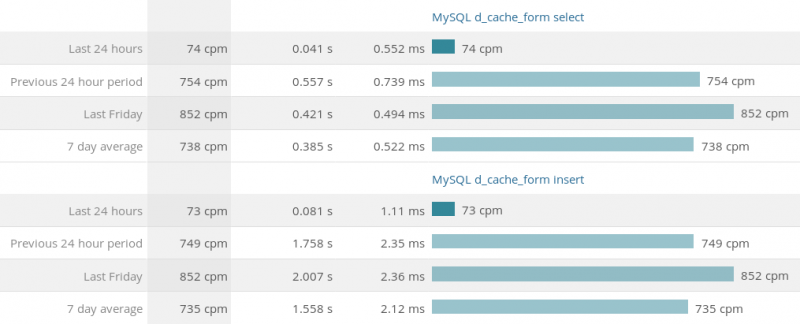
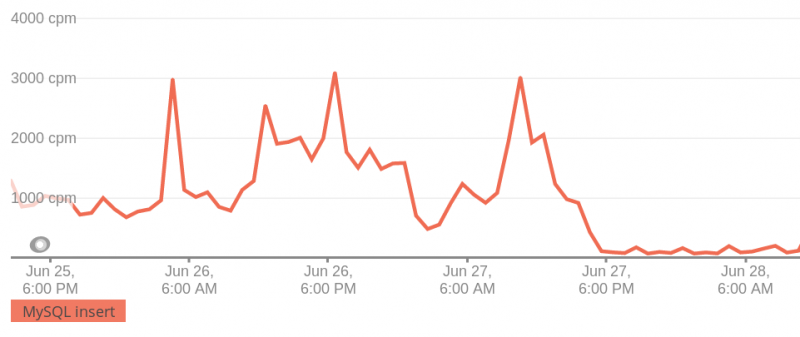
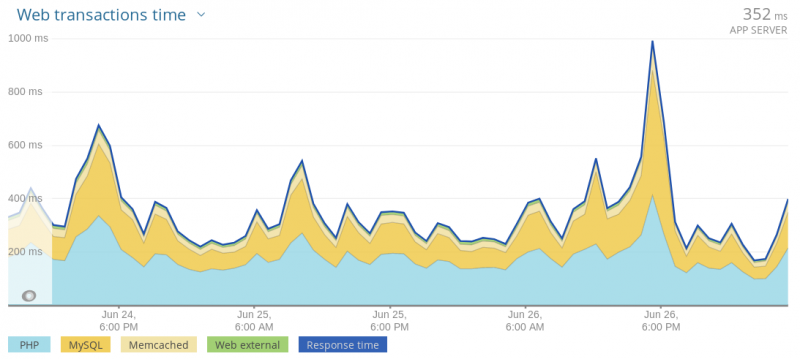
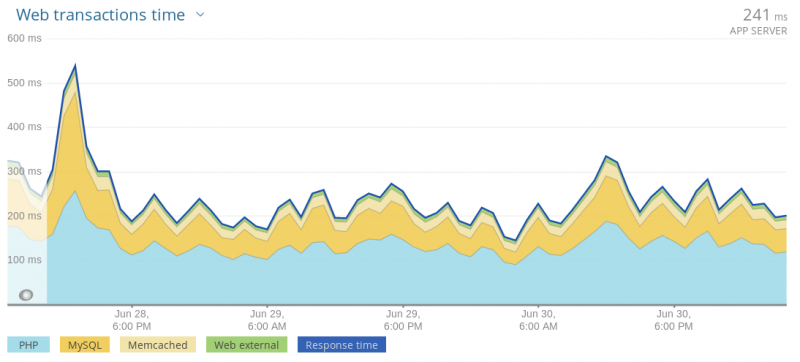
The average time from request to APP SERVER response decreased from 352 milliseconds to 241 milliseconds. The cache_form table shrunk from ~10GB to 200MB.
Thus, we were able to reduce the transaction time by 32%. Improving other forms on the site in the same way can boost the related performance indicators.
Memcached finetuning and page cache monitoring
Page load speed is one of the most important factors affecting bounces and conversions of an online store, or any other site, for that matter.
A slow site essentially nullifies the effect of all and any investments the site owner may have made into conversion optimization. Very often, the reason behind web pages taking too long to load is slow processing of requests and low speed of data exchange server-side.
Hard drive read/write operations are notorious for being excruciatingly slow. Even the fastest current storage devices often fail to deliver the read/write speed required. Caching, i.e. keeping frequently requested data in RAM, is one of the ways to circumvent this problem. Drupal-powered web projects typically rely on the Memcached utility for caching. In this section of the article, we will look at the nuances of setting it up.
Problem
Looking into ways to optimize a Drupal-powered online store and speed it up, we discovered the underlying caching service was acting up. Memcached was set up and running, but the pages were still generated anew each time they were requested, even in case of repeated requests from one and the same visitor.
Diving deep into the problem, we learned that it was not possible to determine the share of memory allocated specifically for web pages, since Drupal caches other things, too. So we decided to put Memcached under the microscope and set it up so it serves web pages from cache.
Analysis
To understand the scale of the problem and evaluate the effectiveness of a potential solution thereto, we used the following tools.
- memcached-tool. A perl script part of the standard Memcached distribution package. Allows viewing stats describing the running Memcached process. A convenient tool used in bash scripts to set up automatic monitoring.
- PHPMemcachedAdmin. A dashboard displaying Memcached performance stats and data, a convenient Memcached monitoring tool.
- Web server logs. We told nginx to also log Drupal cache headers by adding the
$sent_http_x_drupal_cachevariable to the log_format directive. - Zabbix server. A central monitoring node.
Below, you will find the Memcached operation patterns covered in some details, as well as an account of how we used the tools listed above.
Oftentimes, site and server admins install Memcached, give it 1-2 GB of RAM and then forget about it, not bothering with the time-consuming setup process. They think it works great as it is. But is it really so? PHPMemcachedAdmin panel allows a good look at how this service works. Here is an example of the monitoring section's main screen:
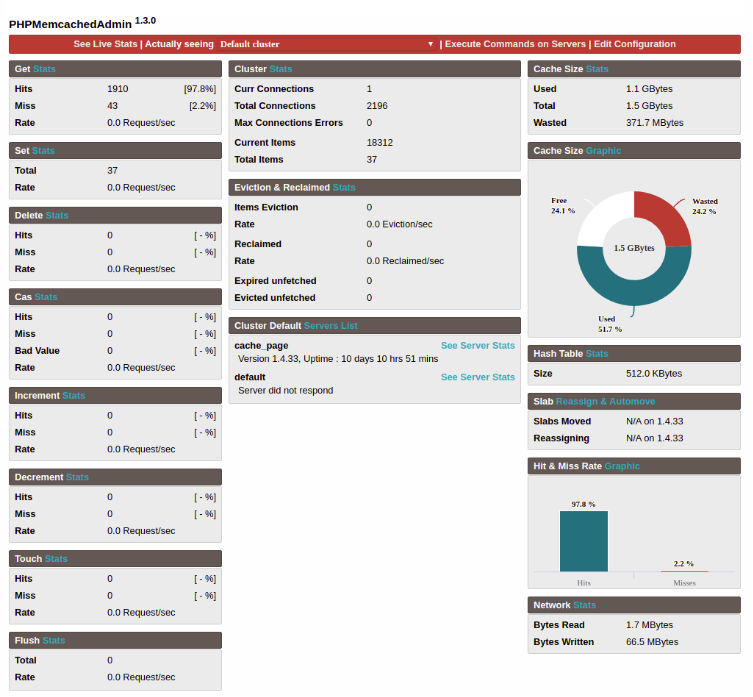
The first thing you want to pay attention to is "Used", which is memory usage. When it is same as "Total", no new requests are cached, obviously.
The second important parameter is "Wasted". If it is high, the allocated memory is not used rationally.
Understanding "Wasted" requires knowledge of how Memcached uses the memory it is given.
Memcached divides the RAM space allocated for it into slabs. A slab, in turn, contains chunks, which store the data. Each slab is made of a number of same size chunks. This data storage pattern enables Memcached to quickly find free memory to write new data into.
Receiving the data, Memcached finds a slab with chunks the size approximately same as the size the said data, and, provided it is free, writes the data thereto. The chunks are then considered occupied and unavailable for writing. If a chunk receives less data than it is capable of holding, this memory surplus is wasted. It remains unused.
Thus, a single glance at the PHPMemcachedAdmin's monitoring dashboard allows you to immediately see how efficiently Memcached uses the memory allocated and decide if some adjustments are in order or not.
If the Wasted figure is relatively low and the memory usage at 100%, it would suffice to increase the memory allocated for Memcached. However, if Wasted is high, you need to optimize Memcached.
The good figures are 15-25% Wasted and 20-25% Free memory. Such values indicate Memchached makes good use of the memory it gets, and there is still some space to cache new requests to.
Solution
Memcached setup depends on the volume of data brought into the cache. This is why the first thing we did was separating page cache from everything else, since page sizes differ greatly from everything else stored in the memory.
To do this, we deployed a second Memcached instance on the client's server. It was not a difficult task: we simply copied the existing systemd unit and changed the path to configuration file therein.
cat /etc/systemd/system/memcached1.service
[Unit]
Description=memcached daemon
After=network.target
Documentation=man:memcached(1)

[Service]
ExecStart=/usr/share/memcached/scripts/systemd-memcached-wrapper /etc/memcached1.conf

[Install]
WantedBy=multi-user.target
Next, we copied /etc/memcached.conf в /etc/memcached1.conf and specified the new socket file therein.
systemctl daemon-reload
systemctl start memcached1 && systemctl enable memcached1
Done. We now have two Memcached instances (memcached and memcached1) that we will teach Drupal to work with.
We are using the Memcached Storage module. To configure it, we change the cache description block in settings.php:
$conf['cache_backends'][] = 'sites/all/modules/memcache_storage/memcache_storage.inc';
$conf['cache_default_class'] = 'MemcacheStorage';
$conf['cache_class_cache_update'] = 'DrupalDatabaseCache';
$conf['cache_class_cache_form'] = 'DrupalDatabaseCache';
# Configure Memcache Storage module.
$conf['memcache_storage_wildcard_invalidate'] = 60 * 60 * 24;
# Set current extension.
$conf['memcache_extension'] = 'Memcached';
# Configure memcached extenstion.
$conf['memcache_options'] = array(
  Memcached::OPT_TCP_NODELAY => TRUE,
  Memcached::OPT_BUFFER_WRITES => TRUE,
  Memcached::OPT_NO_BLOCK => TRUE
);
$conf['memcache_servers'] = array(
  'unix:///tmp/memcached.sock' => 'default',
  'unix:///tmp/memcached1.sock' => 'page',
);
$conf['memcache_bins'] = array(
  'cache'           => 'default',
  'cache_page'      => 'page',
);
# Set custom expiration for cached pages.
$conf['memcache_storage_page_cache_custom_expiration'] = TRUE;
$conf['memcache_storage_page_cache_expire'] = 60 * 60 * 24;
$conf['memcache_storage_key_prefix'] = 'XXXXXXXXXXXX';
$conf['page_compression'] = 1;
$conf['page_cache_maximum_age'] = 60 * 60 * 24;
Excellent! Now pages go to the ruled by memcached1, and everything else goes to that governed by memcached. Now we need to optimize performance of both memcached instances. Important: they have config files of their own, something to keep in mind.
Decreasing Wasted in Memcached
You will most likely see high Wasted figures in your Memcached dashboard at a certain point. Let's see how to decrease them.
First off, we can adjust chunk size. Memcached settings allow specifying the size of the initial chunk, the one created in the first slab, and the growth factor, which is the ratio of size of a larger chunk to a smaller one. Thus, if the size of the initial chunk is 1 kb and the growth factor is 1.15, the chunk in the second slab will be 1 kb x 1.15 = 1.15 kb, in the next slab - 1.15 kb x 1.15 = 1.3225 kb, and so on.
Setting the right initial chunk size and growth factor values is a tedious task. You can think up some that you believe are just what you need, but do check Memcached performance after some time. Chances are, you'll see that you need to adjust those values. It took us about a week to find the optimal initial chunk size and growth factor values for the online store we optimized for our client.
The already mentioned PHPMemcachedAdmin is a good tool for the job. Click the See this Server Slabs Stats link in the dashboard to see slab status, Wasted of each slab, quantity and sizes of each slab's chunks.
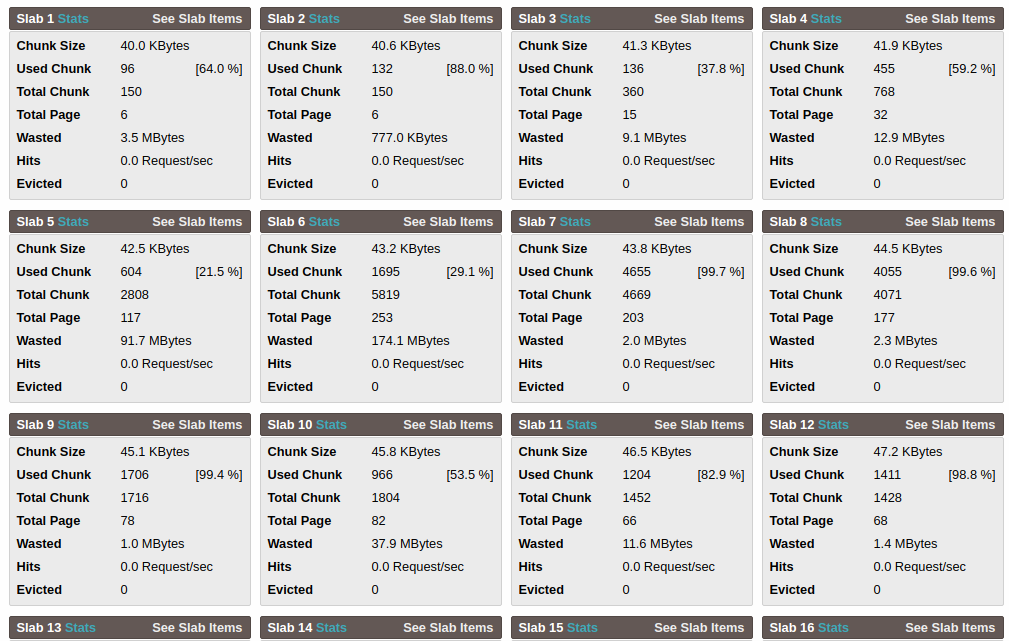
What you need to remember is that the maximum number of slabs is 63. Therefore, do not set the growth factor too low, or you'll end up with many slabs of small chunks, incapable of accommodating larger sets of data.
The following keys are used to configure Memcached parameters:
- -m — sets the amount of RAM for Memcached,
- -n — defines the size of the initial chunk in bytes,
- -f — sets the growth factor.
Here's a quick example of setting up Memcached:
cat memcached1.conf

-m 1536M
-u www-data
-s /tmp/memcached1.sock
-a 0777
-n 40960
-f 1.015
Do not think that Memcached settings optimization is a shoot-and-forget task. As the application develops, the amount of data stored by Memcached may change. We recommend checking Memcached status every now and then and adjust the settings as necessary.
So, we have optimized Memcached and now expect that pages will always be served from cache. To make sure everything works as it should, we can use PHPMemcachedAdmin (again). Its main dashboard has the Hit & Miss Rate section with a histogram showing the number of cache hits. This is a convenient visualization, but it is much more useful to have these data in the monitoring system that tracks cache health and lets you react to changes in the application's performance. The data can be obtained with netcat (nc) console utility, like so:
echo "stats" | nc -U /tmp/memcached.sock -w 1 | grep get_hit | awk '{print $3}'
4330
echo "stats" | nc -U /tmp/memcached.sock -w 1 | grep get_miss | awk '{print $3}'
41
You can launch such simple one-liners with a zabbix agent and store the results of their execution on the zabbix server.
MySQL database performance tuning
MySQL speed is a key factor affecting overall site performance. We rely on MySQLConfigurer, a script we developed, to optimize and boost MySQL: https://github.com/Releem/mysqlconfigurer
The script, suggesting better MySQL parameter values, delivers a 30% boost over default MySQL settings: https://docs.google.com/spreadsheets/d/1J9FDgBGbvNA356d74WKYBaEzSwK7H-wgjHEQgYh8CMI/edit?usp=sharing
When a visitor requests a cached page, Drupal makes no more than two queries to the database. But if a visitor browses to an uncached page or logs in, the number of queries grows considerable.
When a visitor requests a cached page, Drupal makes no more than two queries to the database. But if a visitor browses to an uncached page or logs in, the number of queries grows considerable.
With Memcached, we optimized caching on the block level and Drupal cache to have no more than 300 queries to the database when a visitor browses to a product page not stored in the cache.
Page cache warmup and monitoring
The picture you will see on the monitoring screen may not be to your liking. You will probably see a lot of "miss" loads there, i.e., data requested and not cached. The culprit here is Memcached, the way it is set up.
For a page to be cached, it has to be requested by a visitor. Obviously, site's homepage or popular product pages will make it to the cache quickly. But there are online store visitors that seek off the beaten path and browse to unpopular categories. The pages they request are not coming from cache, they are generated on demand, so to such visitors the site may appear slow, which may be a deal-breaker.
To maximize the number of pages hitting the cache, our team developed the "cache warmup" tool. The tool includes a text file with a list of urls of pages to be added to the cache and a bash script that relies on curl to access each url line in this file.
#!/bin/bash
# url list file
$SOURCEFILE="urls.txt"
# function requesting the page
function cached_url() {
time=$(date +"%T")
curl -LI -w "$time;%{time_total};$1\n" -o /dev/null -s $1
}
# start going through the file, call cached_url function for each url
flag=0
cat $SOURCEFILE | while read url; do
cached_url $url &
let "flag = flag + 1"
if [[ $flag == "4" ]];
then
    # to avoid server overload, we pause now and then
    wait
    sleep 1
    flag=0
fi
done
The script should be cron-launched every night, after site data updates and import, to ensure that the listed pages are cached even before being browsed to by a visitor.
Please note that execution of such a script can take a long time and generate a noticeable load on the server. Therefore, it is necessary to carefully select the time slot to launch it in, and the number of pages to be cached. In the online store optimization case we use as an example here, the pages listed were either very bulky or quite unpopular (rarely visited).
Monitoring caching status in web server logs
Web server logs also allow monitoring cache performance and health. Drupal adds x-drupal-cache to each page. This header's values are HIT or MISS. To monitor these headers, we added the $sent_http_x_drupal_cache variable to the nginx log format. Tracking them allows seeing what pages were served from cache and which were generated on demand. Accumulated data is useful for general situation analysis.
We keep nginx logs in Elasticsearch. Kibana is an Elasticsearch log processing frontend that provides a great set of log visualization, sorting, fetching and analysis tools. After some tweaking, dashboards show comprehensive graphs and histograms of requests hitting the cache.
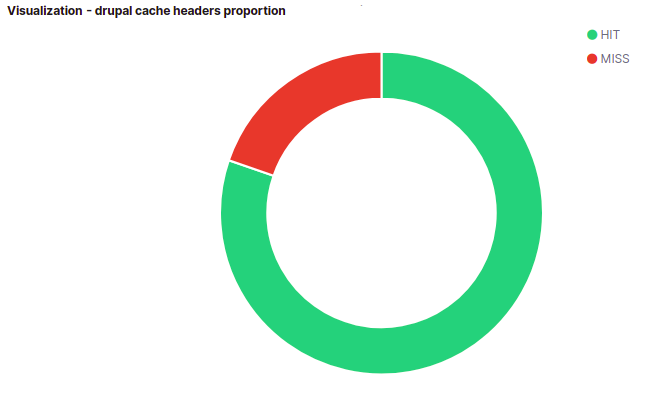
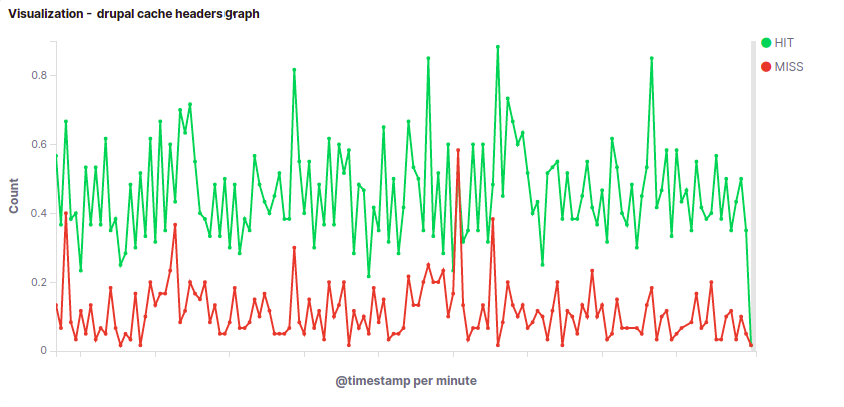
Kibana also allows searching logs and sorting them. For example, you can find all MISS requests and sort them by the number of log entries per day or week, thus compiling a list of top uncached queries. This list is a firm basis for the cache warmup list.
Results
Optimization of AJAX form caching allowed decreasing the request processing time by 32%. Through Memcached finetuning and cache warmup, we managed to have all the online store's landing pages kept in cache and served therefrom.
The tests showed an average page load time of 48 ms. This is a fivefold boost! But other operations require a well-performing server, too.
So, through optimization of the site's code, database and associated software, we made it work faster. But, seeing the traffic to the store growing and number of pages requested increasing rapidly, we realized that the server may fail to deliver properly during rush hours. Also, surplus server resources always come handy when you need to add this or that function to the online store or extend the client's business with a new web project. With this in mind, we told this client it would be wise to move to more powerful and efficient hardware.
Drupal site acceleration: hardware
Before we tackled optimization of the online store, the client had it running on a virtual server: CPU @ 3.2 Mhz 4 core, 16 Gb RAM. We analyzed the store's performance and suggested the following dedicated (instead of virtual) server configuration:
- Intel® Xeon® E-2236 CPU @ 3.40GHz 12 core;
- 32 Gb RAM.
After the move, the average cached page serving time dropped to 11.9 ms, which is great. But the uncached page serving time was just spectacular: it dropped from 616 ms to 102 ms, marking a 76% improvement.
In the end, we got the following results (according to New Relic, a page loading speed monitoring service):
Before online store optimization effort
After online store optimization and migration to a new server
Conclusion
Developing a web project, you need to be very careful about code quality and programming style. Errors made when coding tend to accumulate and, one way or another, increase page loading time, slowing the site down for the visitor. If your code is sloppy and confusing, it is much harder to find the errors and remedy them.
Caching site pages to the server's RAM, especially when this site is a large online store, considerably increases page request processing speed, which means faster site for the visitor. But the typical caching utility needs to be carefully set up by someone who understands how caching works. Approached formally, caching mechanism deployment does not do any good, with the likely result being continued generation of pages on request, with all the hard drive read/write interface limitations applying.
Of course, you want to carefully select configuration of the server to name a web host. Picking a more powerful machine allows faster processing of user requests and better resistance to peak loads. Moreover, surplus server resources enable seamless extension of the site's feature list as the business it drives evolves.
From the visitor's point of view, fast processing of requests by the server, i.e., pages loading quickly in the visitor's browser, makes the stay on the site comfortable, which makes a transaction much more likely and marks the difference between a website that sells and one that is there just for show.
Add new comment